This is part Two of Three in this year’s Home Garden Field Trials Results videos putting charged Biochar and Rock Dust to the test. Today I am going to look at the soil results to see if they support the main claim of each product that through different mechanisms Rock Dust and Biochar increase the nutrient content in the soil.
The trials were set up so the only difference between the beds was the application of Rock Dust in one bed and charged Biochar in another with the third having no products added so it can act as a control. By having the only difference between the beds being the product any differences can be attributed to the product when compared against the control.
If you would like a more detailed description of how we set up the trials I highly recommend watching Part 1 of the 2015 results as it gives more context to the results I will present today. [1]
I would like to address a clarification prior to moving on to the soil’s results. A few of you asked if the biochar had been charged before application. Yes the biochar was charged using biologically active compost and was allowed to settle for 4 weeks prior to planting. Equal volumes of the same homogeneous compost mix were added to the control and rock dust bed. This allowed all three beds to start with the same nutrients and bacterial colonies.
Without further due let’s move on to the soil results. First let’s take a look at the soil pH.
Soil pH
Soil pH is very important as it regulates nutrient availability in soil. Last year’s results found the pH was consistent between each of the beds and in the optimal range for a vegetable garden.
Generally speaking because the pH scale is logarithmic the experts consulted during the development of this episode indicated that a result that differs more than 0.2 is considered statistically different. The control beds pH dropped 0.42 over the season indicating the soil became more acidic.
This springs and falls results varied less than 0.2 for the charged Biochar and Rock Dust beds resulting in them being considered stable.
That said all of this year’s results were within the optimal pH range for vegetable gardens 5.5 – 6.5 [2]. As such it is unlikely that these results have impacted the following results in any significant fashion.
Before we get to the organic nutrients let’s take a look at the total essential and beneficial elements in each of the beds. The results provided by Maxxam Analytics represent mostly micronutrients and are the total plant available and unavailable elements in each of the beds.
Analysis tool RPD
In order to analyze if the results represent a statistical duplicate or are different enough values I used a Real Percent Difference analysis using a very conservative value of 100. If the RPD number is over 100 then the two numbers you are comparing are statistically different. If the value falls below 100 then they are considered statistical duplicates of each other and we can conclude they do not represent a difference in values.
Micronutrient results: Is there a difference in the essential and beneficial elements pre and post season.
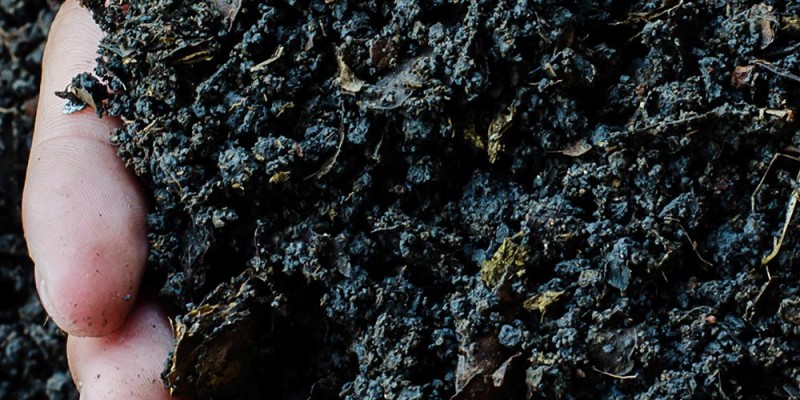
We are analyzing these results because the main claim of both of these products is that their use will result in higher nutrient concentrations in garden soil. Biochar claims that its porosity will act as a sponge in the soil and hold nutrients that would otherwise leach out. Rock dust claims to achieve the same result by simply adding more nutrients in the form of minerals.
Trace elements are used in such low concentrations that over the course of a season we should not see a decrease in concentrations rather both the rock dust and biochar bed should overall have more nutrients than the control if their claims hold up.
Soil tests were taken from the same location in each bed and were a mixture of the soil from the surface to where it meets the underlying parent material. The sample location was immediately adjacent to the 2014 sample location.
Is there a chance in the micro nutrients over the course of a season?
When comparing the spring results to this fall’s results there were no noted differences within the individual trial beds. The take away from this is there is no change within a single season of the micronutrients that are essential and beneficial for plant growth within the individual beds.
Does Biochar improve the retention of micro nutrients?
When comparing the charged biochar pre and post season to the control there was no difference in:
Boron, Calcium, Iron, Magnesium, Manganese, Phosphorus, Potassium, Sodium, Sulphur, Cobalt, Copper, Molybdenum, Nickel, Selenium and Zinc.
Meaning there was no statistical difference in micronutrients between the charged biochar bed and the control
Does Rock Dust improve the retention of micro nutrients?
The Rock Dust results had statistically the same amount of the following elements in the pre-season results:
Boron, Calcium, Iron, Magnesium, Manganese, Phosphorus, Potassium, Sodium, Sulphur, Cobalt, Molybdenum, Nickel and Selenium.
In the pre-season the rock dust had lower concentrations of a number of elements however only Zinc and Copper are considered essential for plant growth.
What is quite interesting though as I mentioned earlier the results that Maxxam Analytics gave us represents both the plant available and unavailable elements. So when I compared the post season results for the Rock Dust it would seem that there is no longer a difference in the elemental make up as all of the RPD numbers fall under 100.
This is very interesting as there was no external addition of material with the exception of the soil contained by the seed starts for the tomatoes and peppers. I knew this could be a variable the sample location for both 2014 and 2015 were the same and selected to avoid locations where this soil may have been added.
When I looked further into these results I noticed that the elements that can dissolve in water did not show this trend but the heavy metals that don’t dissolve did. Elements that can be transported by water are called soluble salts and because of this they are generally much more evenly distributed in the soil. Heavy metals however are not soluble and are often found in hot spots in the soil.
This year’s results can likely be explained by this phenomenon. Even though the beds were well mixed the heavier elements still settled in hot spots and were not evenly distributed. So when taking any of the samples there is a chance you would not transect one of these pockets and the resulting data would show lower concentrations.
Organic nutrients analysis
I am going to park the elemental results for a moment and move on to the organic nutrients. The results presented represent only the plant available nutrients in the soil. Nitrogen, Phosphorus, Potassium and Sulfur are required by plants in much higher concentrations. They can also be referred to as macronutrients.
As plants require these nutrients in larger concentrations we should expect to see a drop over the course of the season. Nitrogen, Phosphorus, Potassium and Sulphur did show drops in concentrations throughout the season as their RPD numbers were well over 100.
When we then compared the pre-season rock dust and charged biochar beds to the control there was no statistical difference in organic nutrient content with the exception of slightly more Nirtate in the control bed when compared to the Rock Dust bed. The trend then reverses in the post season with the Rock Dust bed having slightly more Nitrate than the control. This can be easily explained by the relatively transient nature of nitrogen in the soil.
Discussion Rock Dust
The reason we spent so much time on the analysis of the nutrients is both of these products claim to impact nutrients. Specifically Rock Dust claims to add many elements via different minerals and charged biochar claims to retain nutrients in the soil.
These products are sold and marketed to gardeners like myself whom take great care in the garden soil. So the results only represent rich soil conditions and a poor soil trial may yield different results.
The results presented today for the most part show that neither of these products have had an impact on the nutrient retention or addition in the soil.
As a part of the sampling efforts last year I had two of the main horticultural grade commercial rock dust products tested and the raw biochar used in the trials.
At face value this years trial results are very confusing. For instance rock dust has high concentrations of Calcium however the control bed has statistically the same concentration of calcium as the amended rock dust bed. It makes a lot more sense when you think of how these products are recommended to be applied.
We applied rock dust at a much higher rate than what is recommended by advocates and producers. A larger application rate was chosen in order to ensure that if this product has an effect it would be clearly seen. According to the manufacturer there is no risk of this product harming the soil or plant through over application.
The application rate ended up being 1lbs or 453 grams of rock dust per square foot or 30 square centimeters. In one square foot 12 inches deep of garden soil each of the beds has a cubic volume of 1728 inches or 28,317 cubic cm of soil. To this we are adding 28 cubic inches (458 cubic cm) of rock dust to 1728 cubic inches of soil (28,317 cubic cm). This represents 1.6 % of the total volume when mixed in. [3]
In order for rock dust to have an impact on the total nutrient content of the garden soil, even at this much higher than recommended application rate, the product would have to contain several orders of magnitude more nutrients.
The product I purchased cost 80$ Canadian for a 22kg or 48.5lbs. That is quite expensive as the other resources used in my garden that add much higher concentrations of nutrients and are free.
Discussion Biochar
Charged Biochar was applied at a 0.5 lbs or 226 grams per square foot. Although the volume was larger for biochar it again is a negligible concentration when compared to the total soil volume.
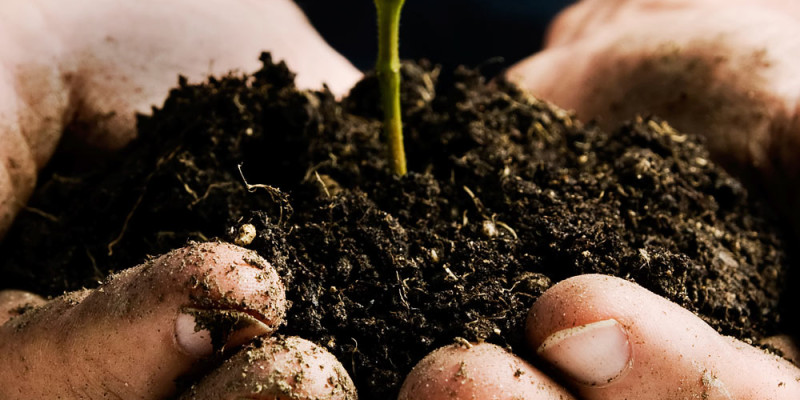
That said even though the biochar did come with some micronutrients its product claim relies on nutrient retention as appose to directly adding it. That said a rich garden soil usually has high concentrations of humus. Humus much like biochar acts as a sponge in the soil helping to retain nutrients. What may have happened this year is the soil we started with was already excellent at holding nutrients in place and as such the addition of biochar would not increase this ability hence the results of no net increase in nutrients.
Conclusion
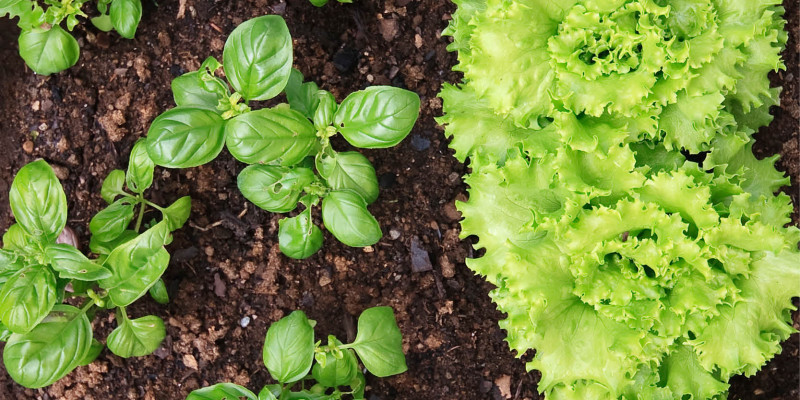
In part 1 of this years 3 part results videos for the Home Garden Field Trials we saw the control bed producing the highest volume of crops followed with a slightly lower charged biochar bed and a significantly lower rock dust bed.
Today’s results do not explain why there was such a variance in the harvest of each bed however they do cast some doubt on the central claims of both of these products as amendments for home gardens.
It would appear that even at the much higher application rate of rock dust fails to live up to its central product claim of adding meaningful amounts of trace elements to the soil. The product claim is flawed simply because the application rate and its comparatively low concentration of elements results in no net increase in micro and macronutrients.
Charged biochar also fall short in my backyard garden trial. Charged biochar product claim is that it holds onto nutrients reducing leaching from the soil. It is likely not as effective simply because the soil is already retaining nutrients at a high level of efficiency.
While today’s results may not support the main product claims for soil enrichment on the third video in this series I will take a look at the second most prominent product claim that produce grown in these products will take up more elements increasing their nutrient density. Next time we will take a look at the elemental makeup of the produce and tissue produced in all three trial beds and compare the rock dust and charged biochar grown crops to the control to see if there is any difference.
References
[1] Part 1 of the 2015 Home Garden Field Trials Biochar and Rock Dust Harvest Results:[2] Optimal pH range for Vegetable Gardens
http://pss.uvm.edu/ppp/pubs/oh34.htm [3] Weight to volume for rock dust
http://buildasoil.com/blogs/news/11485089-how-much-does-each-amendment-weigh
Lab Results
Pre Season 2015 Results:
http://www.albertaurbangarden.ca/wp-content/uploads/2015/11/151120_AlbertaUrbanGardenCertificateofAnalysisRevisedReport3.pdf
Post Season 2015 Results:
http://www.albertaurbangarden.ca/wp-content/uploads/2015/11/151120_AlbertaUrbanGardenCertificateofAnalysisRevisedReport4.pdf
Biochar and Rock Dust Raw Data Results:
http://www.albertaurbangarden.ca/wp-content/uploads/2015/11/151120_AlbertaUrbanGardenCertificateofAnalysisRevisedReport.pdf
2014 Post Season Results:
http://www.albertaurbangarden.ca/wp-content/uploads/2015/11/151120_AlbertaUrbanGardenCertificateofAnalysisRevisedReport2.pdf